Overview
This article delves into the critical role of the analytics dashboard in direct-to-consumer (DTC) wine sales. It underscores how these dashboards consolidate key performance indicators (KPIs) and deliver insights that are essential for enhancing operational efficiency and driving revenue growth. By integrating data from diverse sources, wineries can effectively monitor customer behavior and assess marketing effectiveness. This strategic approach ultimately fosters improved sales performance and cultivates customer loyalty.
Understanding the analytics dashboard is not merely beneficial; it is imperative for success in the competitive wine market. With the ability to track and analyze KPIs in real-time, wineries gain a comprehensive view of their performance, enabling informed decision-making. This data-driven perspective empowers businesses to adapt their strategies, ensuring they remain responsive to market demands and consumer preferences.
In conclusion, leveraging an analytics dashboard is a decisive step for wineries aiming to enhance their operational capabilities and boost sales. The integration of customer insights and performance metrics paves the way for sustained growth and a loyal customer base. It is time for wine producers to embrace these tools, transforming data into actionable strategies that drive success.
Introduction
The wine industry is undergoing a seismic shift, as direct-to-consumer (DTC) sales become increasingly vital for growth and sustainability. In this evolving landscape, analytics dashboards emerge as powerful tools that not only consolidate critical performance metrics but also provide actionable insights into:
- Consumer behavior
- Inventory management
- Marketing effectiveness
However, the pressing question remains: how can vineyards effectively harness these dashboards to transform data into strategic advantages and foster lasting customer loyalty in a competitive market?
Define the Analytics Dashboard for DTC Wine
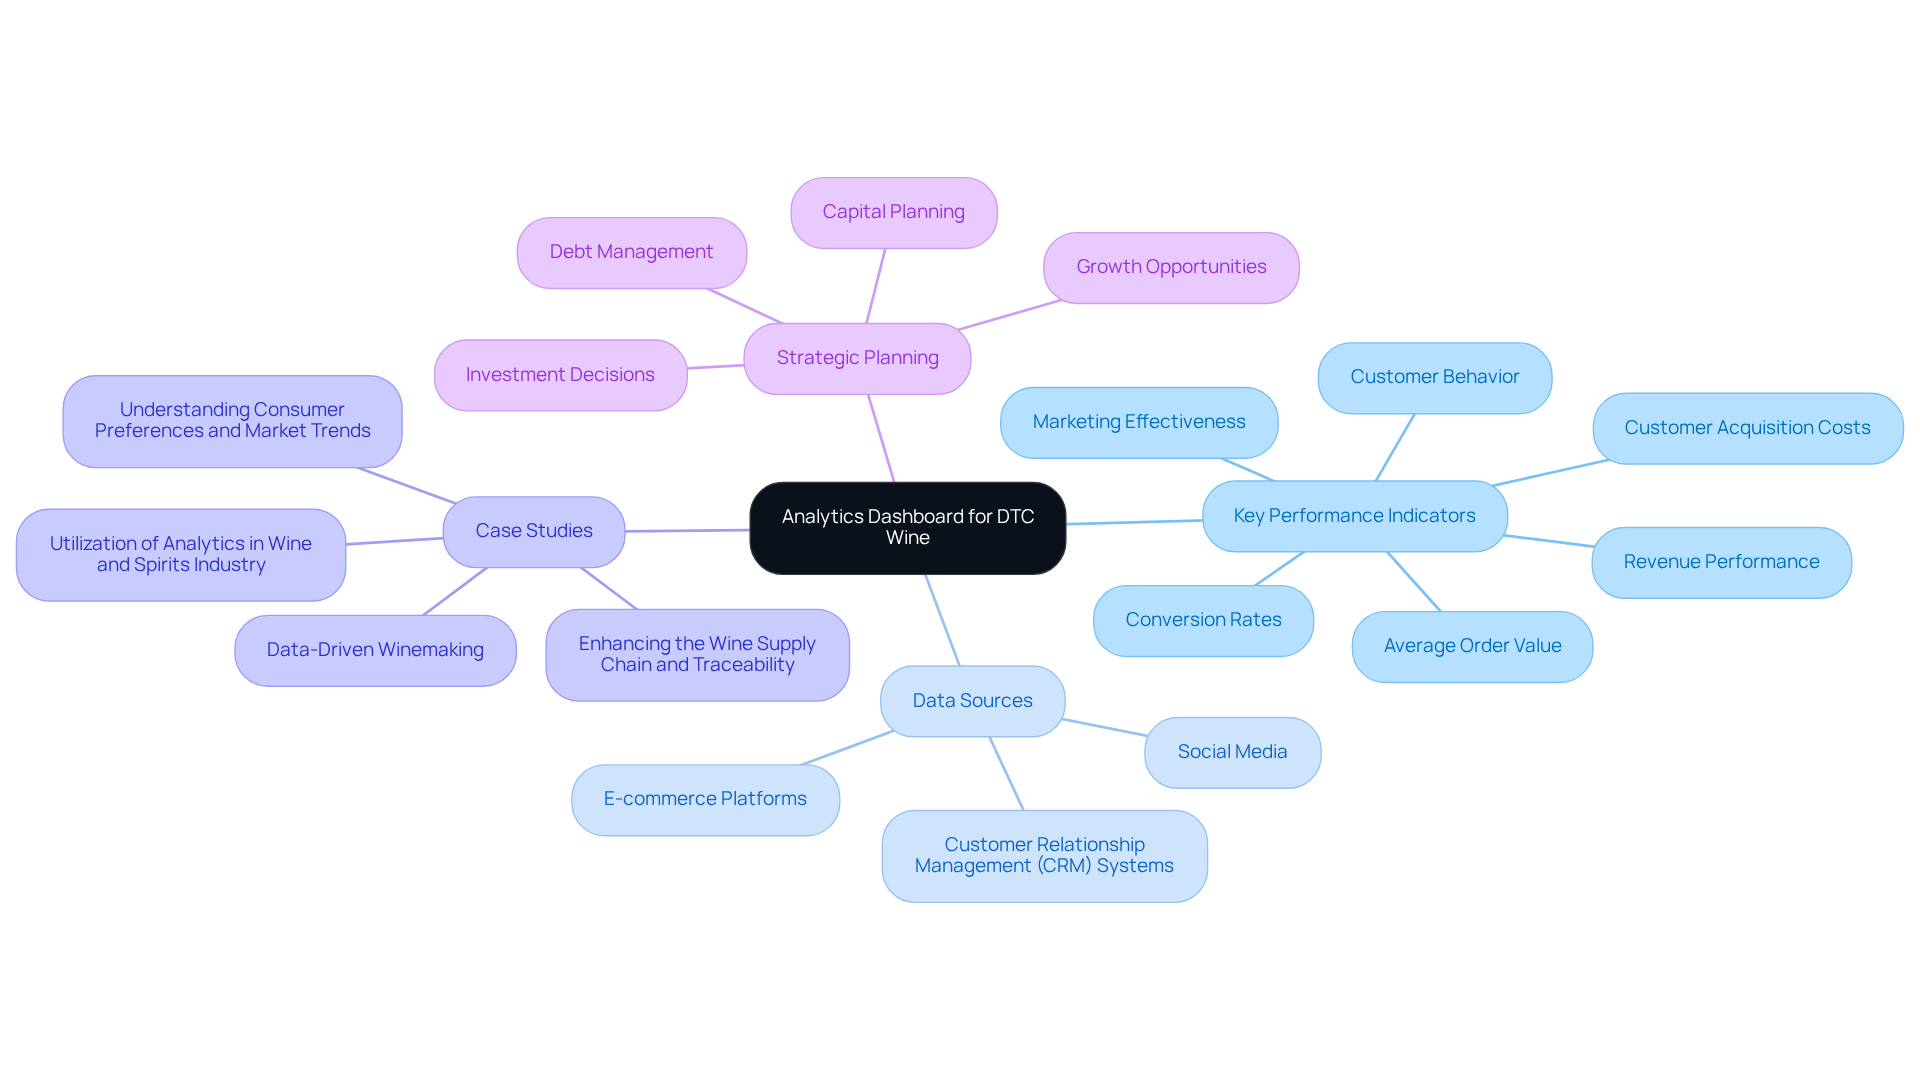
An analytics dashboard for dtc wine transactions acts as a crucial visual interface that consolidates and displays key performance indicators (KPIs) and metrics essential for a vineyard's DTC activities. These displays offer immediate insights into various aspects, including revenue performance, customer behavior, inventory levels, and marketing effectiveness. By integrating data from diverse sources—such as e-commerce platforms, customer relationship management (CRM) systems, and social media—wineries can swiftly make informed decisions that enhance operational efficiency and drive revenue growth.
The importance of these displays cannot be overstated; they empower vineyards to thoroughly monitor their performance through the analytics dashboard for dtc wine. For instance, establishments utilizing data visualization tools have reported significant improvements in sales and customer engagement. By tracking KPIs like conversion rates, average order value, and customer acquisition costs, businesses can identify trends and adjust their strategies accordingly, transforming casual buyers into loyal club members through proven methods.
Moreover, successful case studies illustrate how vineyards have leveraged an analytics dashboard for dtc wine to refine their marketing strategies and optimize inventory management through data analysis. For example, a vineyard that implemented a data visualization tool was able to increase its online revenue by 30% within a year by capitalizing on insights regarding customer preferences and purchasing trends. This not only boosts immediate revenue but also fosters lasting customer loyalty, making analytical displays an indispensable asset in the competitive landscape of the wine industry.
Additionally, the analytics dashboard for dtc wine plays a vital role in facilitating strategic capital planning, enabling vineyards to align their operational insights with financial strategies. By understanding consumer trends and revenue patterns, vineyards can make informed decisions regarding investments, debt management, and growth opportunities. This comprehensive approach ensures that data analysis not only enhances revenue but also supports the establishment's long-term sustainability and market presence.

Contextualize the Importance of Analytics Dashboards in DTC Wine
In the dynamic landscape of the wine sector, the analytics dashboard for DTC wine has emerged as an indispensable tool for producers aiming to refine their direct-to-consumer marketing strategies. With online sales on the rise, is vital for sustaining a competitive advantage.
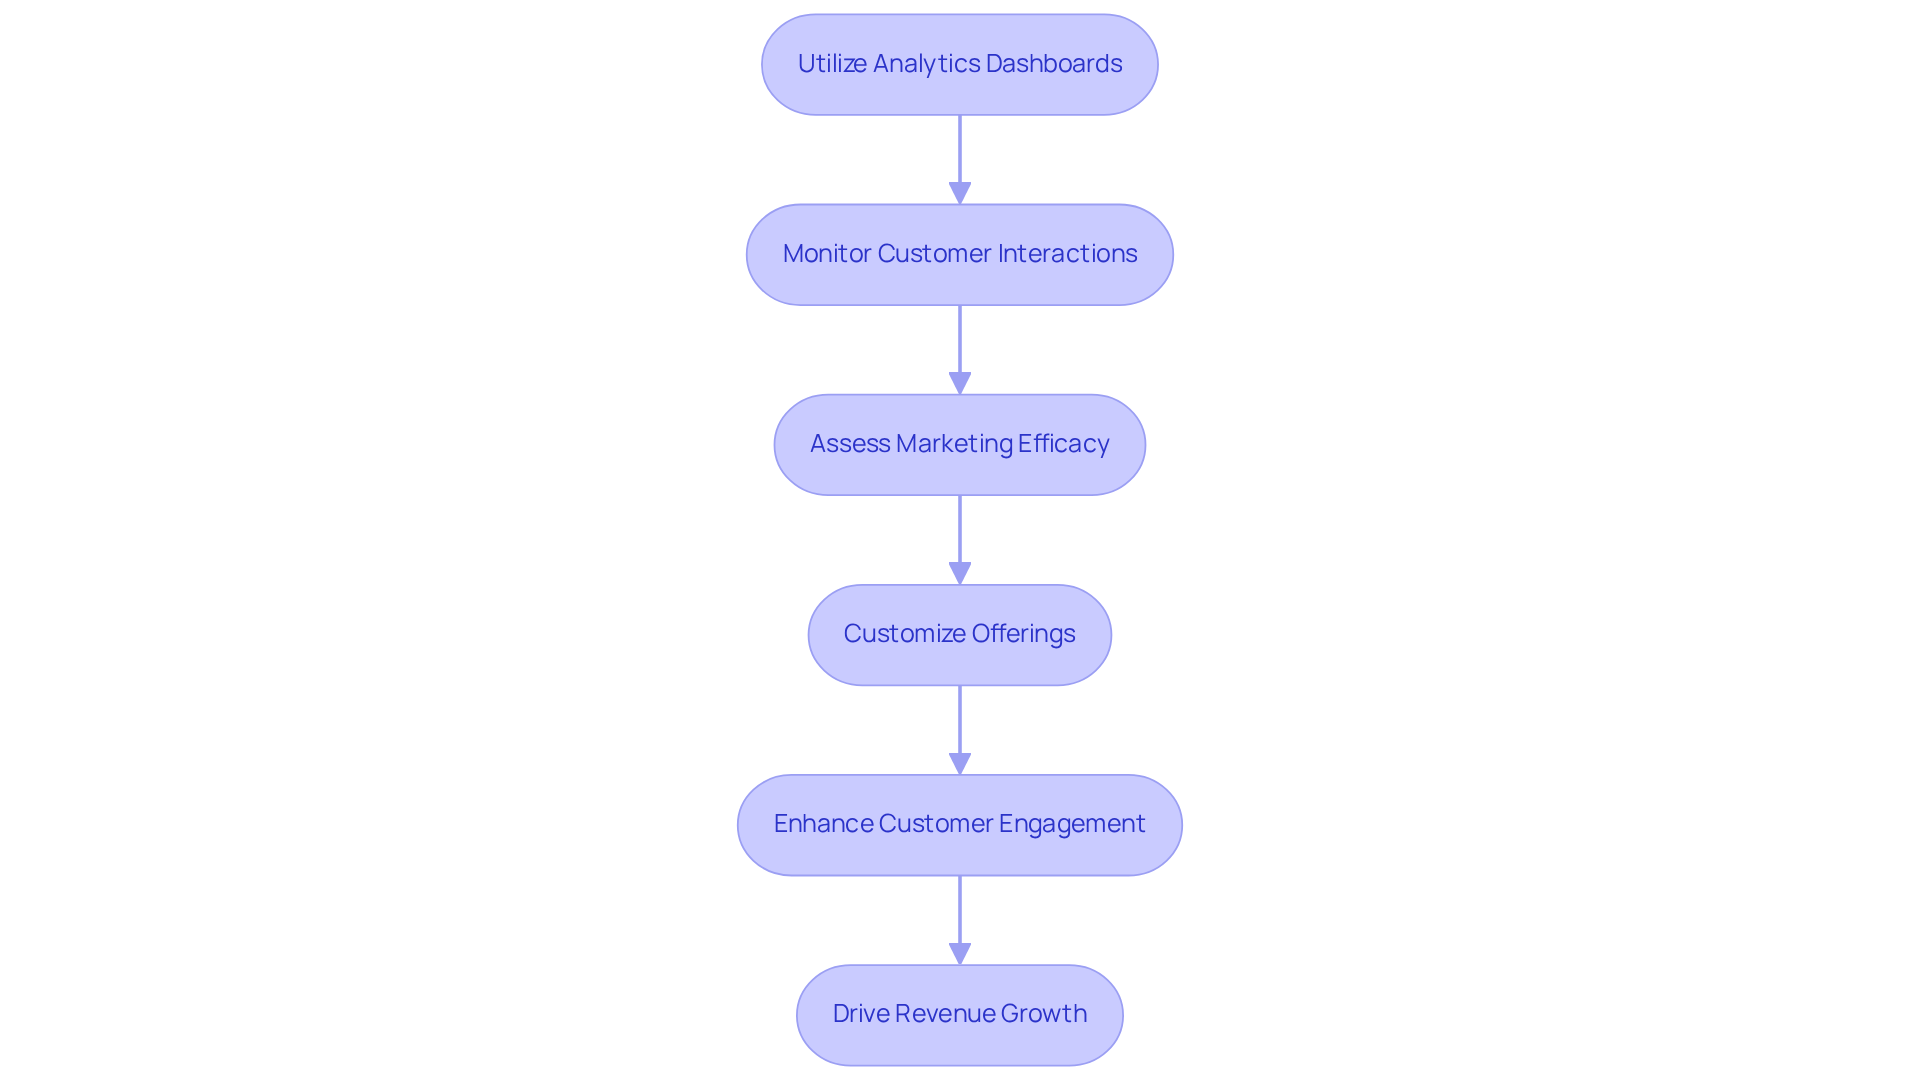
Enocap's strategic capital advisory services, which encompass customized debt, equity, and acquisition solutions, empower family-owned vineyards to harness these dashboards effectively. These instruments enable vineyards to monitor customer interactions and purchasing behaviors through an analytics dashboard for DTC wine, while also assessing the efficacy of marketing initiatives.
By embracing a data-centric approach, vineyards can customize their offerings and enhance customer engagement, ultimately driving increased revenue and loyalty. Furthermore, as the DTC market expands, vineyards must leverage an analytics dashboard for DTC wine to uncover new avenues for growth and innovation.
For instance, vineyards that have integrated data analysis, supported by Enocap's strategic services, have reported significant improvements in their revenue performance, with some achieving e-commerce growth rates exceeding 190%. This trend highlights the critical role of real-time data in facilitating informed decisions that propel success in an increasingly competitive arena.

Trace the Evolution of Analytics Dashboards in the Wine Industry
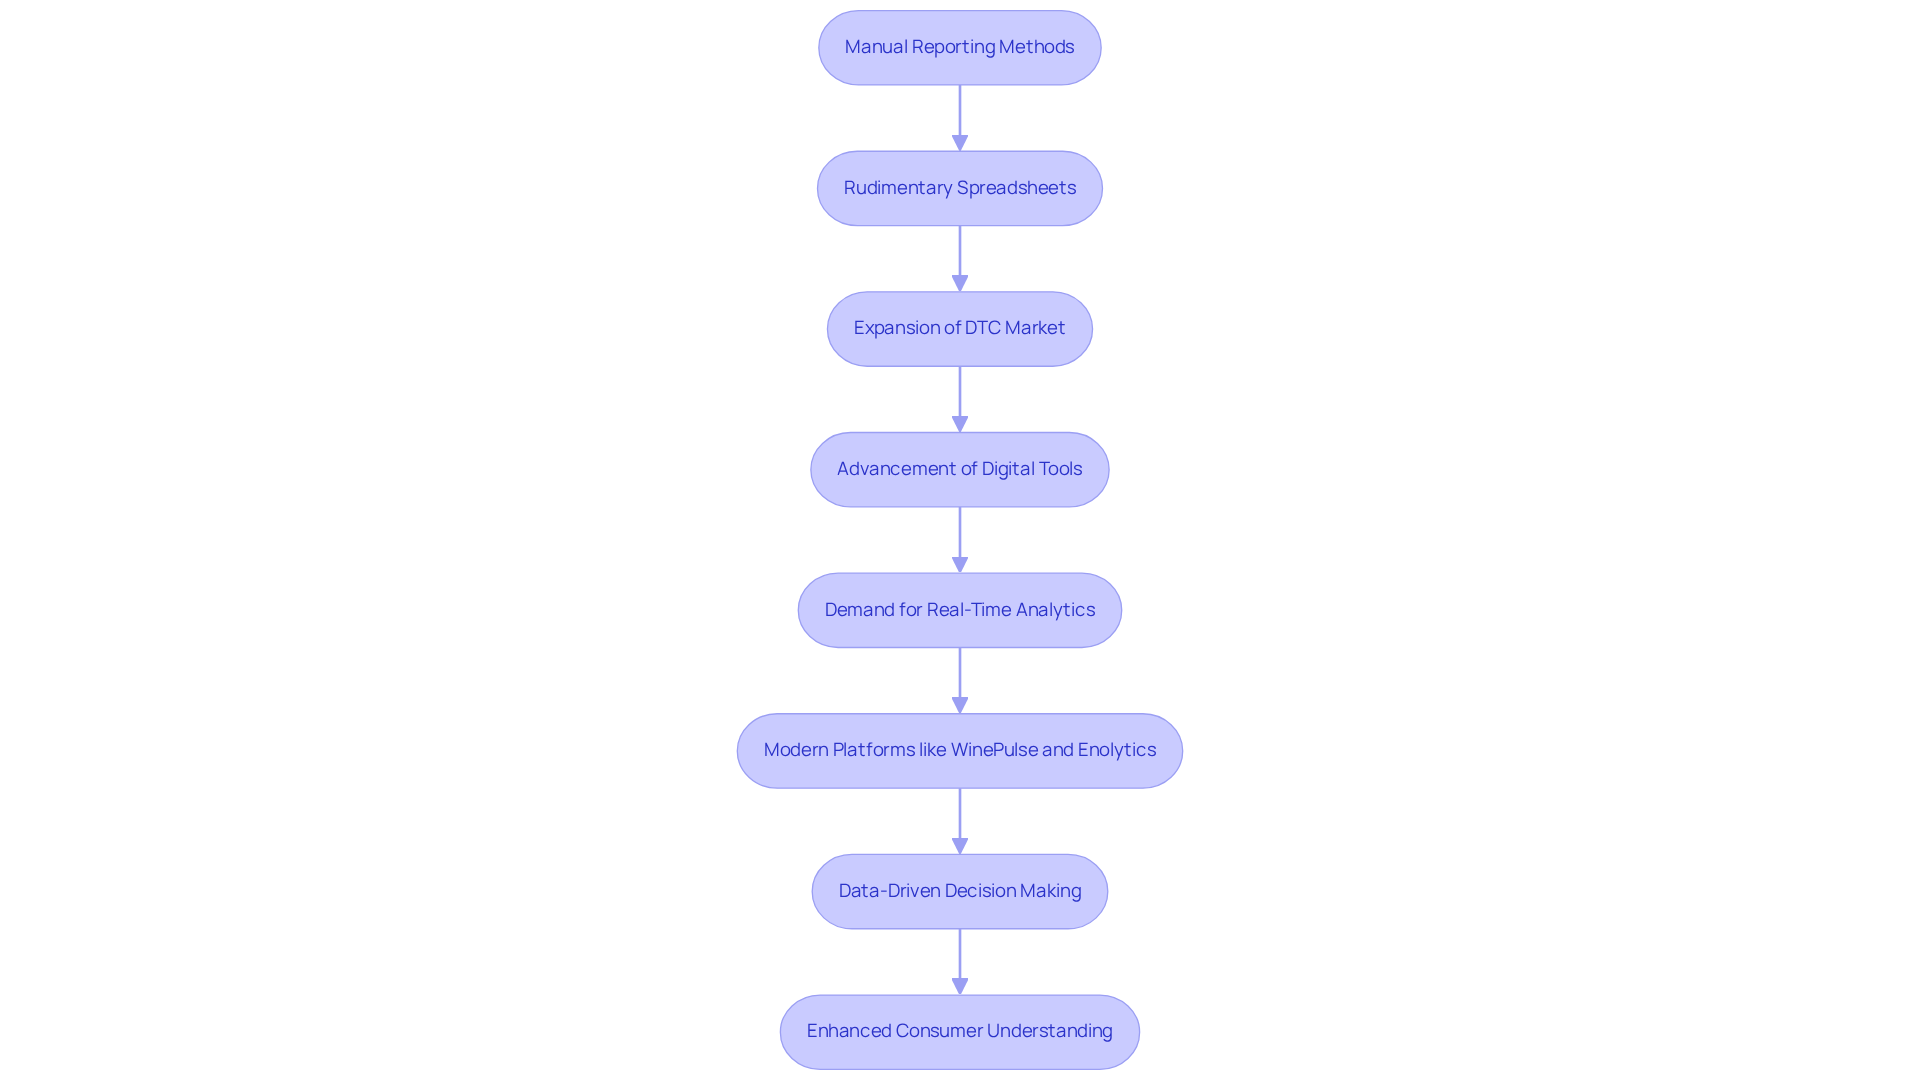
The evolution of data visualization panels in the wine sector has been significantly influenced by the growing accessibility of information and the necessity for vineyards to adapt to shifting consumer behaviors. Initially, vineyards depended on rudimentary spreadsheets and manual reporting methods to monitor sales and customer interactions. However, with the expansion of the direct-to-consumer (DTC) market and the advancement of digital tools, the demand for real-time analytics has surged.
Modern platforms such as WinePulse and Enolytics now provide an analytics dashboard for DTC wine that seamlessly integrates diverse data sources, empowering producers with actionable insights at their fingertips. This transformation underscores a broader industry trend toward , allowing producers to swiftly respond to market fluctuations and evolving consumer demands.
The shift from traditional techniques to sophisticated data analysis not only enhances operational efficiency but also fosters a deeper understanding of consumer preferences, ultimately driving growth and sustainability within the competitive wine market. By leveraging these data tools, family-owned vineyards can implement transformative DTC strategies that include an analytics dashboard for DTC wine, promoting steady growth, crafting engaging brand narratives, and strategically preparing for financial needs to ensure their legacy thrives for generations.
Enocap plays a pivotal role in this process by providing tailored strategies that assist wine producers in converting casual buyers into loyal club members, thereby enhancing their direct-to-consumer channels. As Bernard Marr notes, 'The growing significance of data and analysis in the wine industry is fostering substantial advancements in vineyard management, winemaking, and consumer insight.

Identify Key Features of Effective DTC Wine Analytics Dashboards
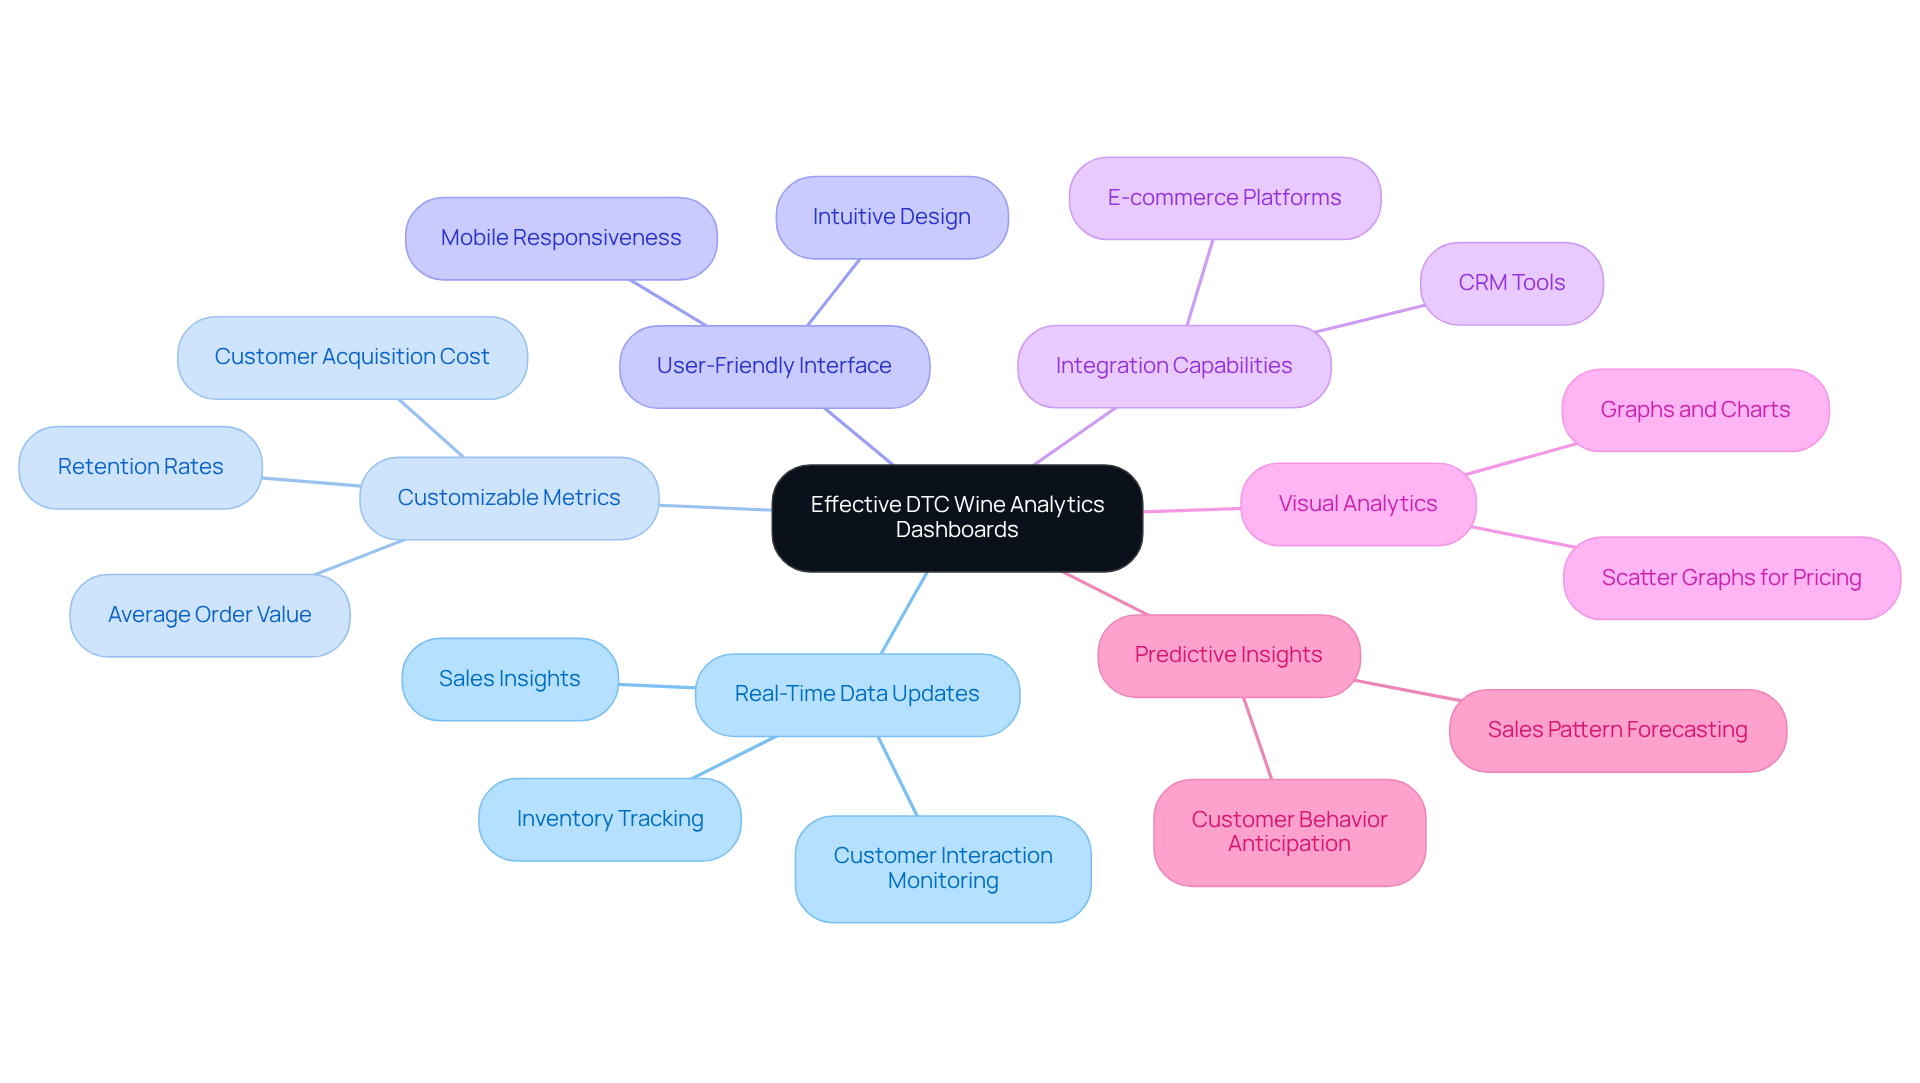
To maximize their utility for wineries, effective DTC wine analytics dashboards must incorporate several key features that align with transformative strategies for family-owned wineries:
- Real-Time Data Updates: Dashboards must deliver real-time insights into sales, inventory, and customer interactions, enabling timely decision-making that can significantly impact revenue and support sustainable growth strategies.
- Customizable Metrics: Users should have the flexibility to adjust the interface to display metrics aligned with their specific business goals, such as average order value, customer acquisition cost, and retention rates. Understanding customer preferences and buying patterns is crucial, especially as the global subscription economy is projected to reach $1.5 trillion by 2025. This highlights the need for wineries to adapt quickly to market changes and transform casual buyers into loyal club members.
- User-Friendly Interface: A clean and intuitive design is essential for ensuring that users can easily navigate the control panel and interpret the data presented. With around 76% of web traffic in the U.S. coming from mobile devices, a and usability for all users, facilitating effective brand storytelling.
- Integration Capabilities: The ability to integrate with existing systems, such as popular e-commerce platforms and CRM tools, is vital for consolidating data from multiple sources, streamlining operations, and improving overall efficiency. This integration is crucial for strategic capital planning.
- Visual Analytics: Effective displays utilize visual representations of data, such as graphs and charts, including scatter graphs for pricing by SKU, to make complex information more accessible and understandable. This method aids in swiftly recognizing trends and making knowledgeable choices that improve DTC sales initiatives.
- Predictive Insights: Sophisticated interfaces may integrate predictive insights to anticipate future sales patterns and customer behaviors, enabling vineyards to proactively modify their strategies. This capability is becoming increasingly significant as vineyards encounter challenges from changing consumer habits and rising expenses, as highlighted by industry experts.
By integrating these features, wineries can leverage an analytics dashboard for DTC wine to enhance their DTC sales efforts, improve customer engagement, and drive sustainable growth, ultimately transforming their business for future generations.

Conclusion
The analytics dashboard for direct-to-consumer (DTC) wine sales stands as a crucial instrument for vineyards, providing a comprehensive visual interface that consolidates essential performance metrics and insights. By leveraging data from diverse sources, wineries can make informed decisions that enhance operational efficiency, drive revenue growth, and cultivate customer loyalty. This shift from traditional reporting methods to advanced data analysis highlights the indispensable role of these dashboards in maintaining a competitive edge within the dynamic wine industry.
Throughout this discussion, key elements such as real-time data updates, customizable metrics, and user-friendly interfaces are underscored as vital features of effective DTC wine analytics dashboards. The integration of predictive insights and visual analytics further empowers wineries to identify trends and adapt their strategies, ultimately resulting in increased sales and improved customer engagement. Successful case studies reveal that vineyards utilizing these tools have witnessed significant revenue growth and enhanced marketing effectiveness, illustrating the tangible benefits of embracing a data-driven approach.
In a landscape where consumer preferences are evolving rapidly, adopting analytics dashboards for DTC wine sales is not merely advantageous but essential. Wineries are urged to invest in these tools to unlock new growth opportunities and refine their marketing strategies. By doing so, they not only secure their current market presence but also lay the groundwork for sustainable success in the future. The significance of analytics in the wine industry is evident: those who adapt and innovate through data will excel in an increasingly competitive marketplace.
Frequently Asked Questions
What is an analytics dashboard for DTC wine?
An analytics dashboard for DTC wine transactions is a visual interface that consolidates and displays key performance indicators (KPIs) and metrics essential for a vineyard's direct-to-consumer activities, providing insights into revenue performance, customer behavior, inventory levels, and marketing effectiveness.
Why are analytics dashboards important for vineyards?
Analytics dashboards are important because they empower vineyards to monitor their performance, allowing for informed decision-making that enhances operational efficiency and drives revenue growth. They help track KPIs, identify trends, and adjust strategies to improve sales and customer engagement.
What types of data sources are integrated into the analytics dashboard?
The analytics dashboard integrates data from various sources, including e-commerce platforms, customer relationship management (CRM) systems, and social media.
Can you provide an example of how a vineyard benefited from using an analytics dashboard?
One example is a vineyard that implemented a data visualization tool, which resulted in a 30% increase in online revenue within a year by utilizing insights on customer preferences and purchasing trends.
How does the analytics dashboard help in marketing strategies?
The analytics dashboard helps refine marketing strategies by analyzing data to identify customer trends and preferences, which can lead to more effective marketing campaigns and improved customer acquisition and retention.
What role does the analytics dashboard play in capital planning for vineyards?
The analytics dashboard facilitates strategic capital planning by aligning operational insights with financial strategies, helping vineyards make informed decisions regarding investments, debt management, and growth opportunities.
How does data analysis contribute to customer loyalty in the wine industry?
Data analysis contributes to customer loyalty by enabling vineyards to understand consumer behavior and preferences, allowing them to tailor their offerings and strategies to transform casual buyers into loyal club members.


